Appearance
Managing Deployments and Billing
After deploying with HaaS, use the Publisher Portal deployments dashboard to monitor status, view logs, metrics and perform maintenance actions.
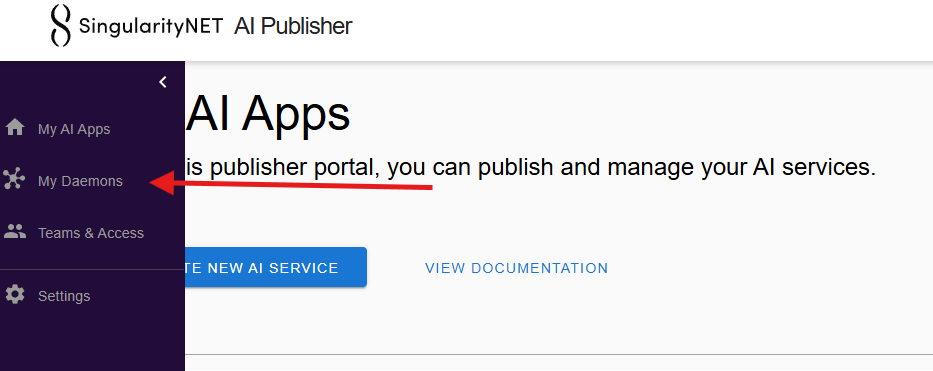
Accessing the Dashboard
Navigate to My Deployments in the left sidebar of the Publisher Portal to open the deployments dashboard.
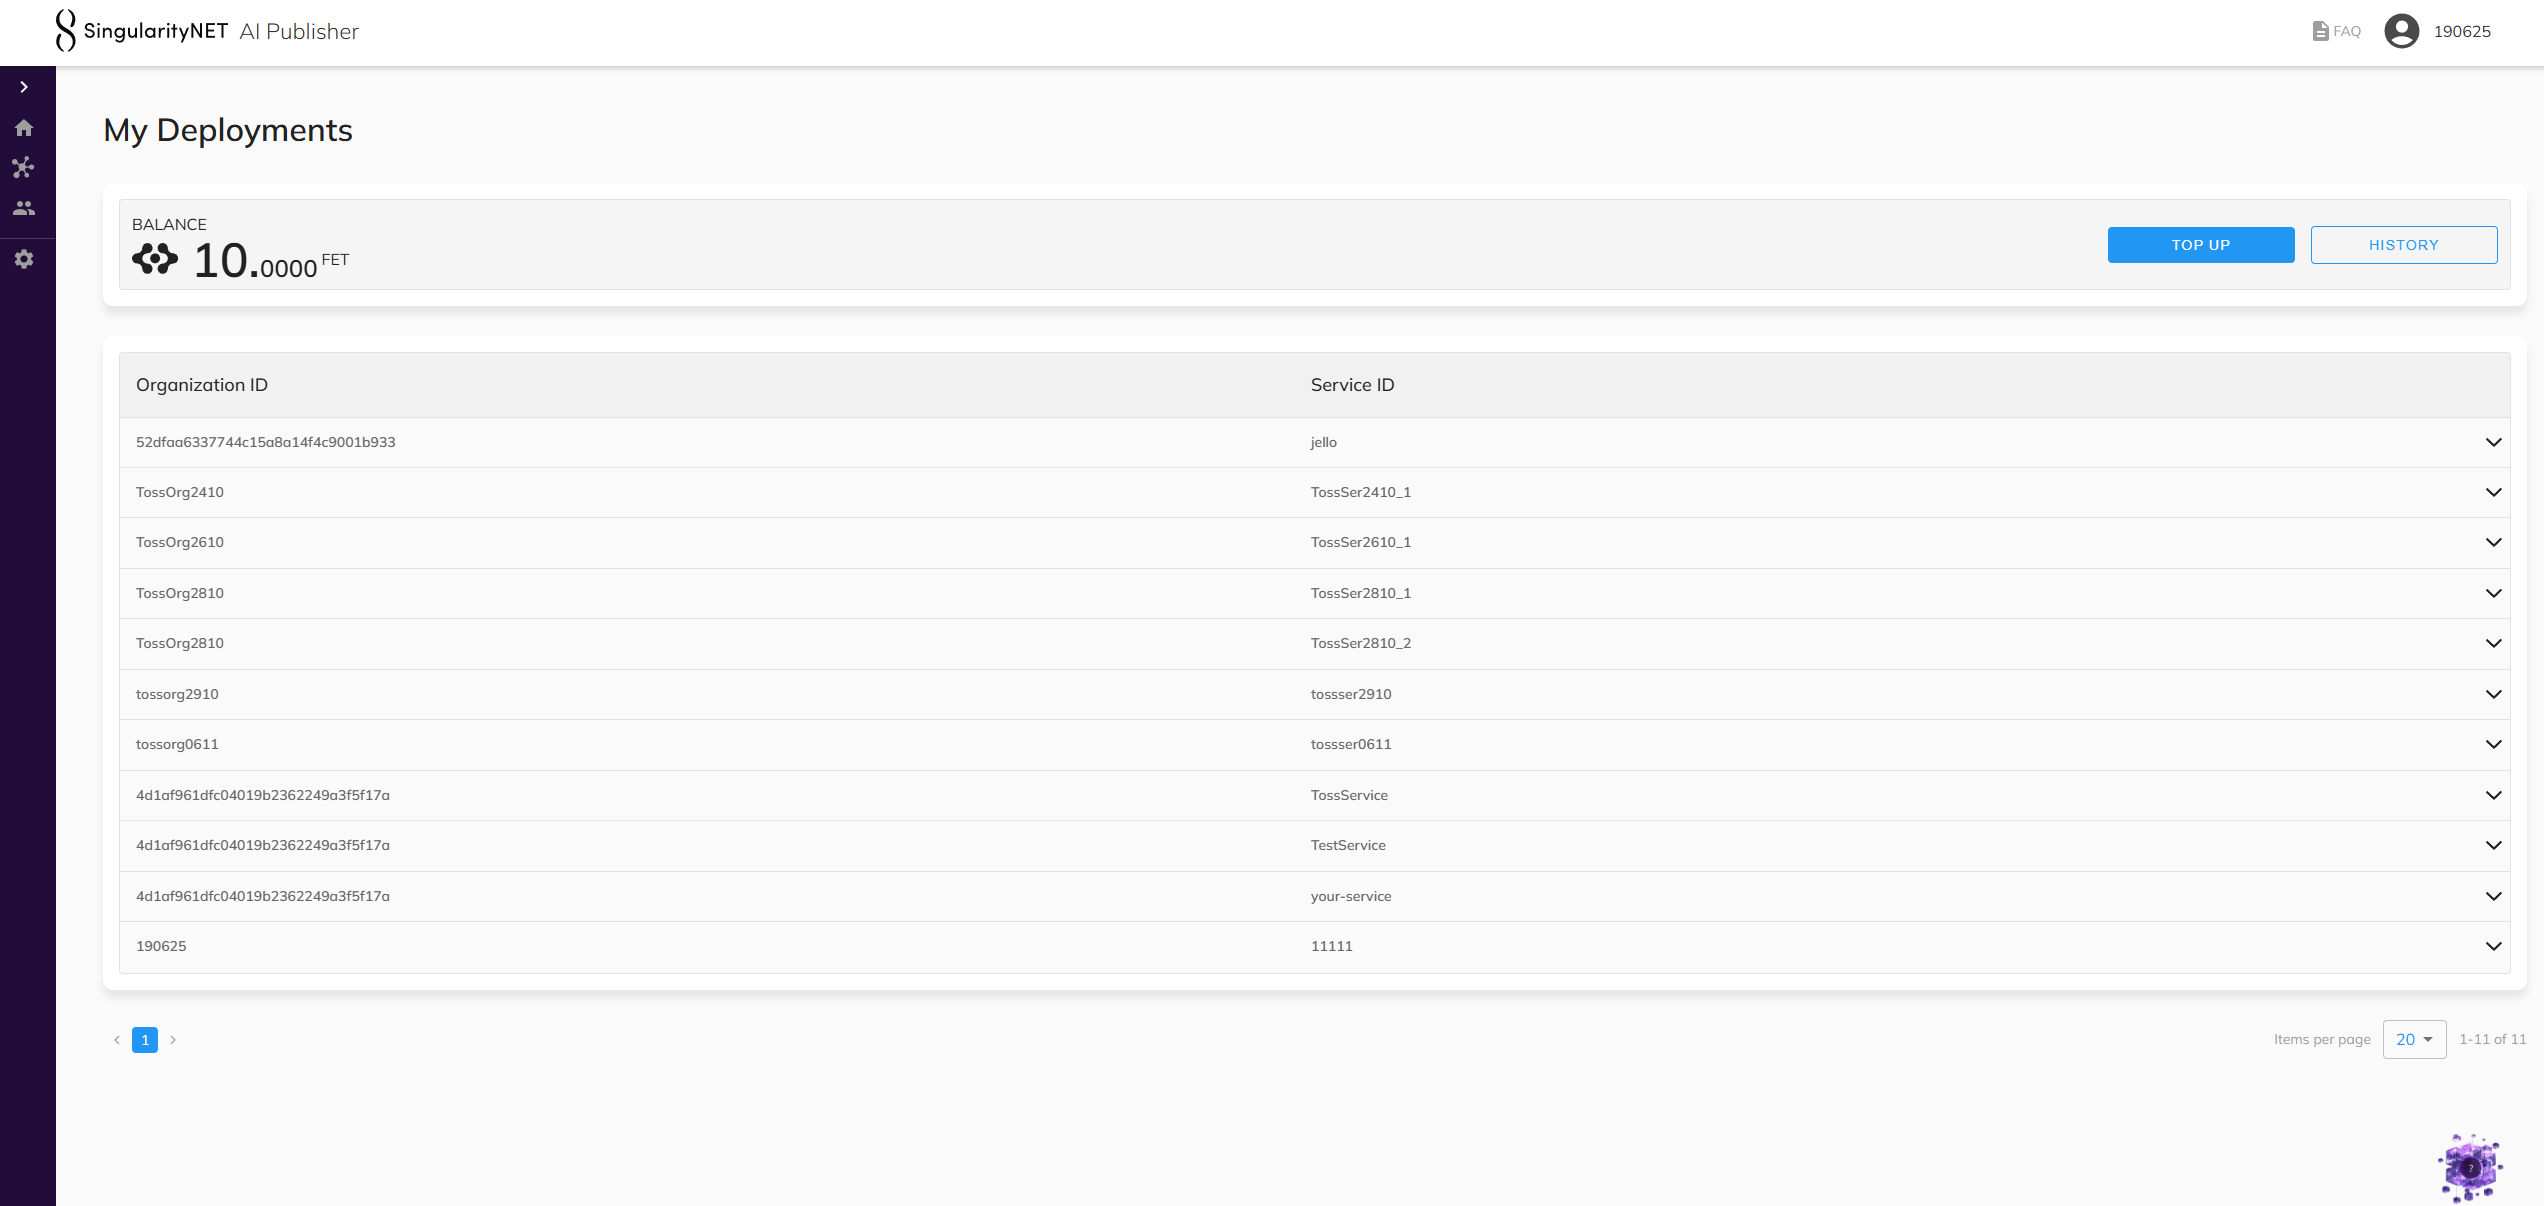
At the main page you will see:
| Element | Description |
|---|---|
| Balance | Your current FET token balance on the platform |
| Top Up | Button to add funds to your account |
| History | Button to check your balance history |
The deployments table lists all your services with their Organization ID and Service ID:
Deployment Details
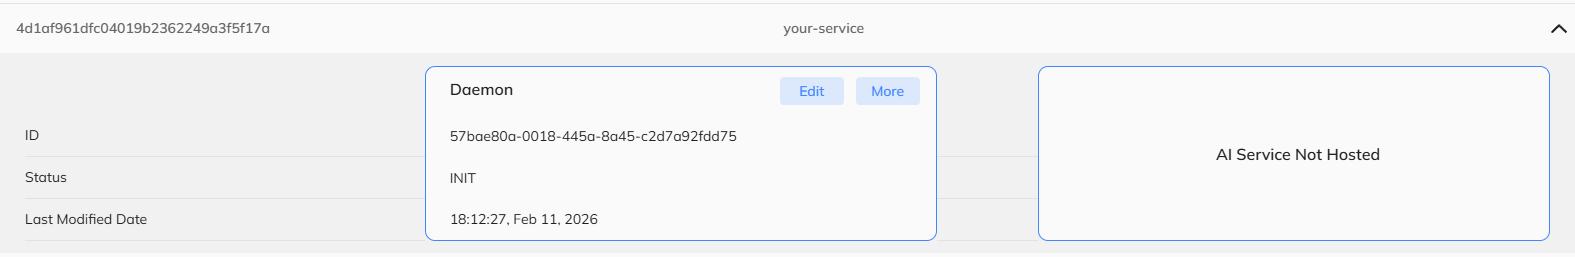
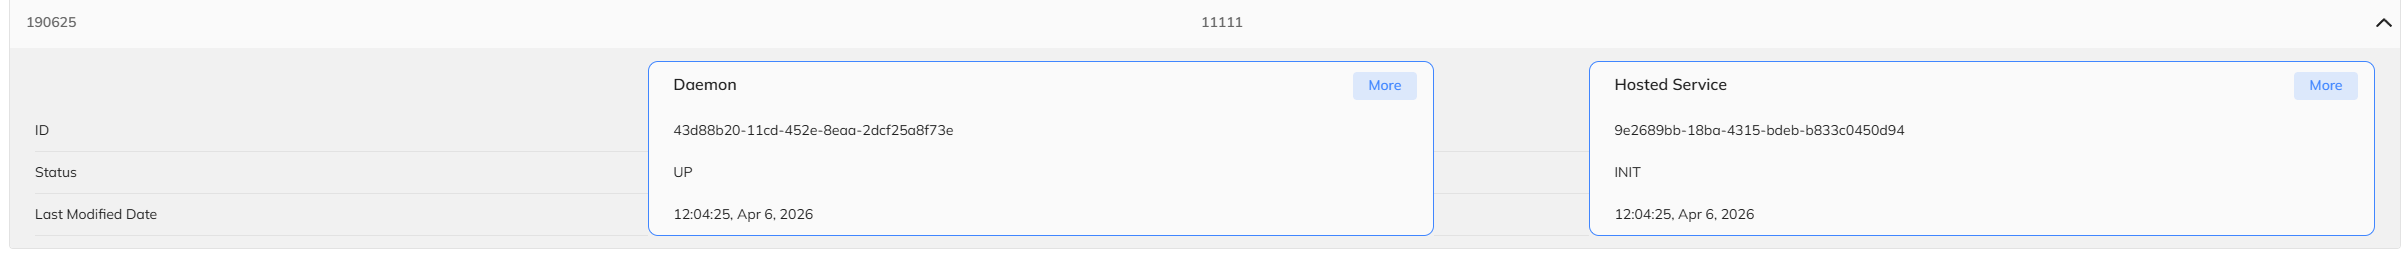
Click on any deployment row to expand it. The expanded view shows two cards:
| Card | Description |
|---|---|
| Daemon | Daemon ID, status, last modified date, and a More button for full details |
| Hosted Service | Hosted service ID, status, last modified date, and a More button (Full-Stack only) |
Daemon Information
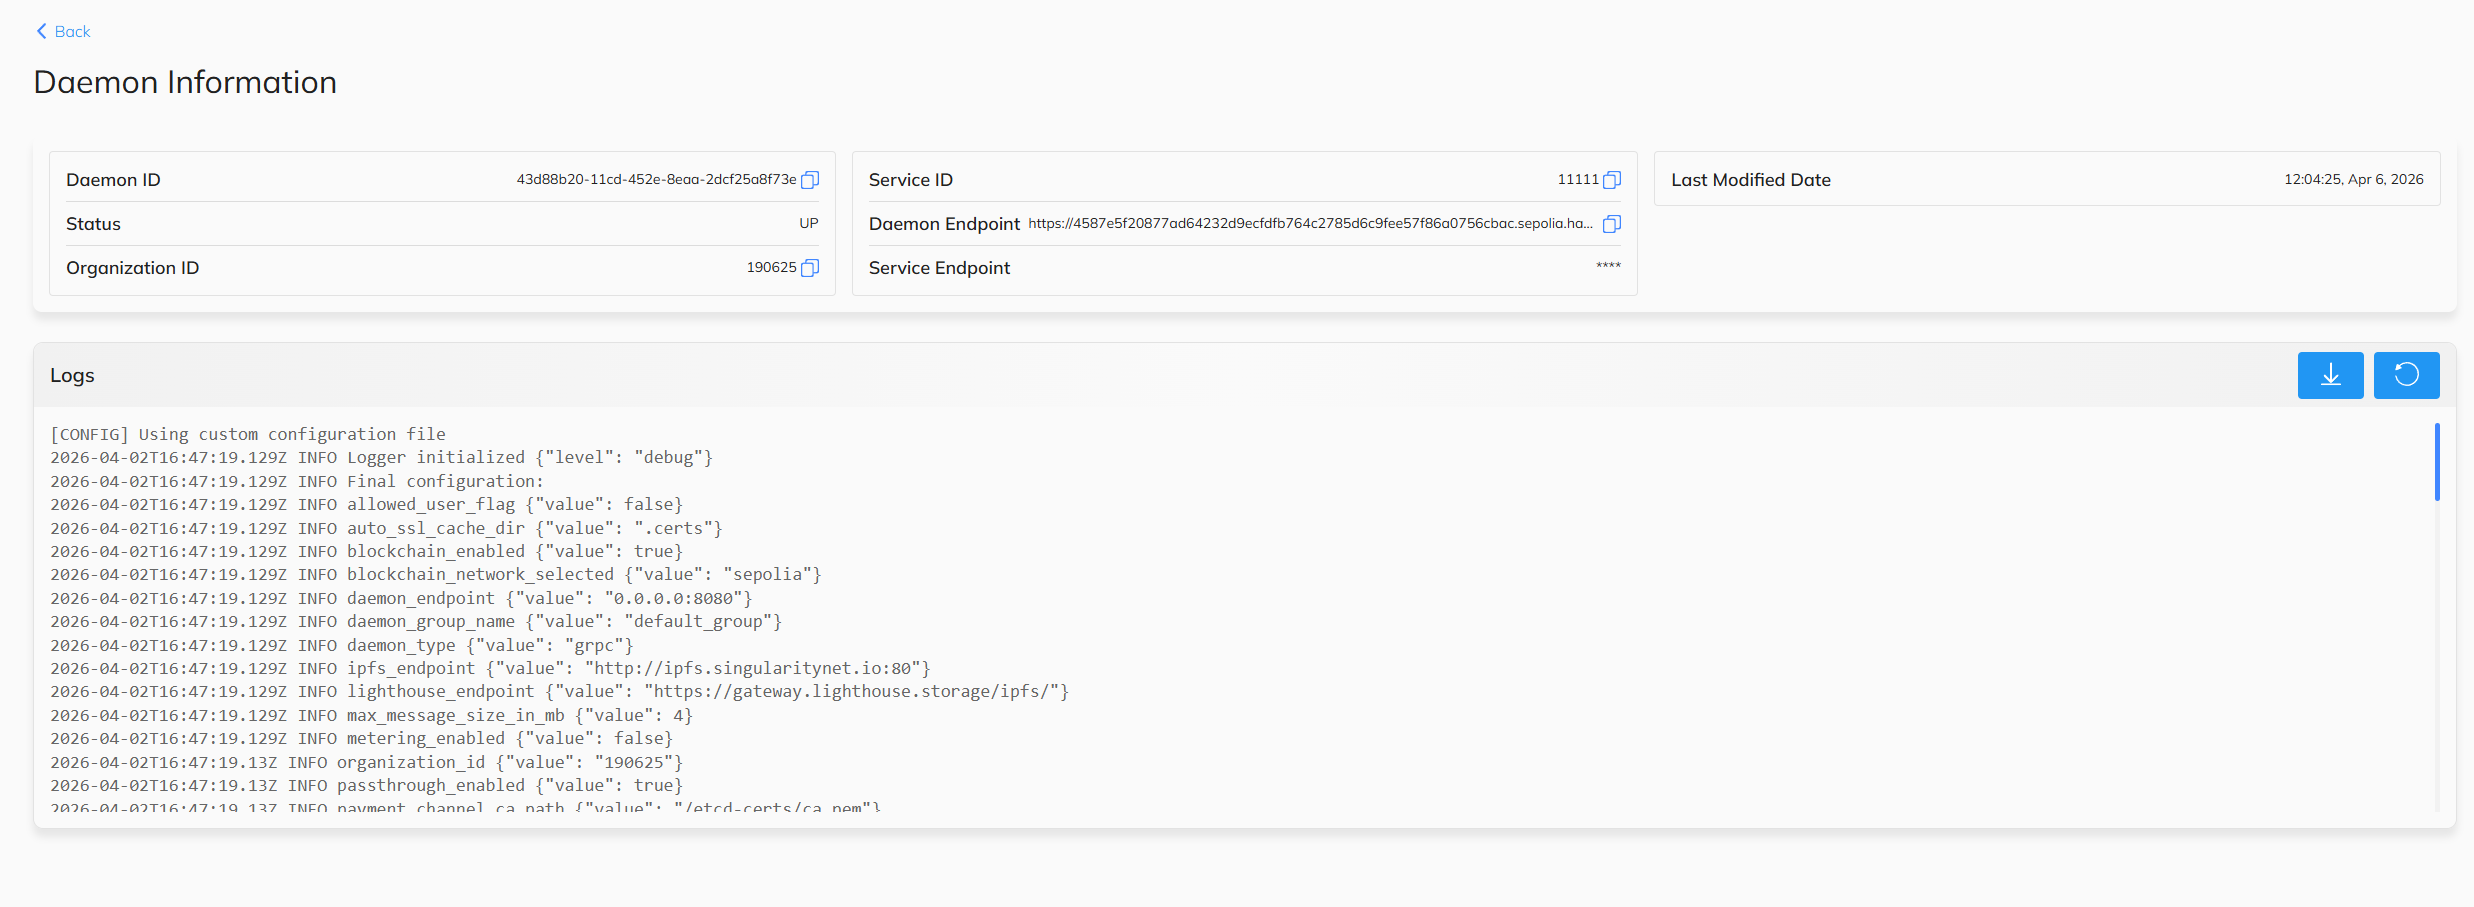
Click More on the Daemon card to view the full daemon details page:
| Field | Description |
|---|---|
| Daemon ID | Unique identifier |
| Service ID | Associated service |
| Status | Current operational state |
| Daemon Endpoint | Public HTTPS endpoint |
| Organization ID | Parent organization |
| Service Endpoint | Connected AI service URL |
| Last Modified Date | Last status change |
The page also includes Logs — live daemon logs with configuration details, endpoints, and runtime information.
Daemon Status Indicators
| Status | Meaning |
|---|---|
INIT | Daemon entity is created, awaiting deployment |
STARTING | Daemon is being deployed |
UP | Daemon is deployed and actively handling requests |
DOWN | Daemon is stopped or subscription expired |
ERROR | Daemon encountered an error during deployment |
Hosted Service Information
TIP
This section applies only to Full-Stack deployments.
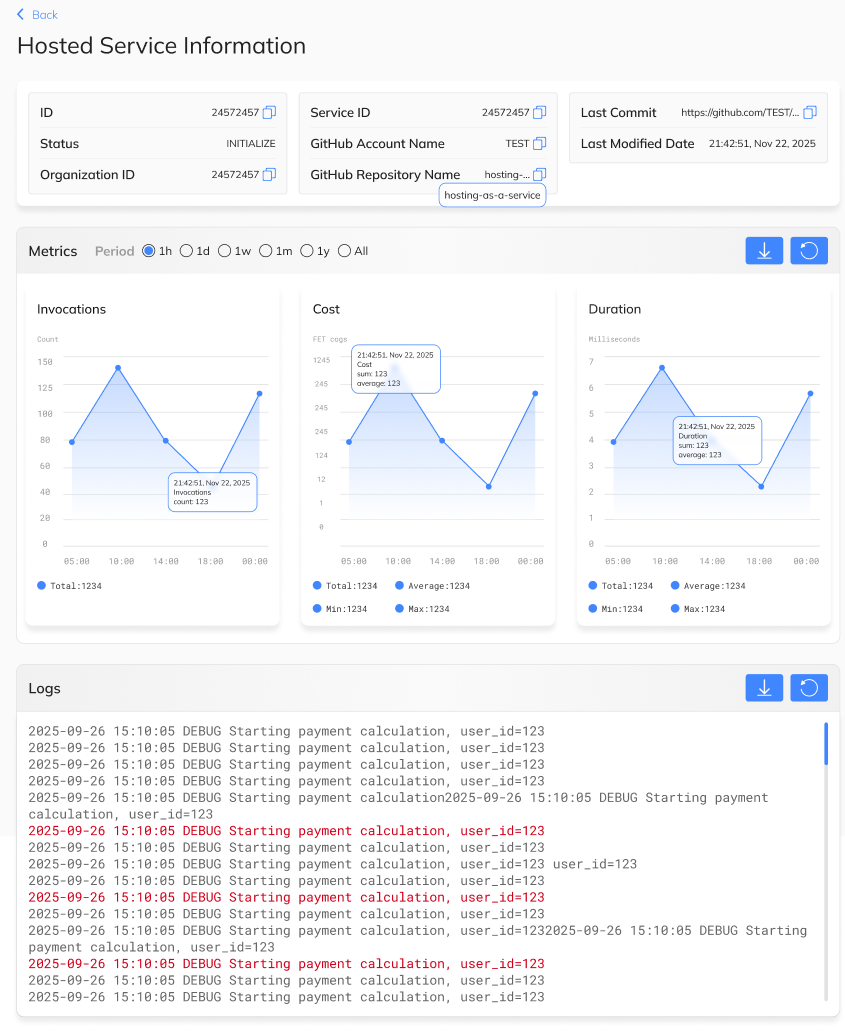
Click More on the Hosted Service card to view the AI service details page:
| Field | Description |
|---|---|
| Service ID | Unique identifier |
| Organization ID | Parent organization |
| Status | Current deployment stage |
| GitHub Account Name | Repository owner |
| GitHub Repository Name | Repository name |
| Last Commit | Link to the last deployed commit |
| Last Modified Date | Last status change |
The page also includes:
- Metrics — real-time graphs for Invocations, Duration, Cold Starts, and Warm Starts
- Logs — live service logs with request processing details
Hosted Service Status Indicators
| Status | Meaning |
|---|---|
INIT | Service entity is created, awaiting deployment |
STARTING | Service is being built and deployed |
UP | Service is live and handling requests |
DOWN | Service is stopped |
ERROR | Deployment failed — check logs for details |
Updating Your Service
Daemon Only Deployments
Update the daemon configuration (service endpoint or authorization) by clicking the Edit button on the daemon detail page. A modal will appear where you can modify the service endpoint and authorization parameters.
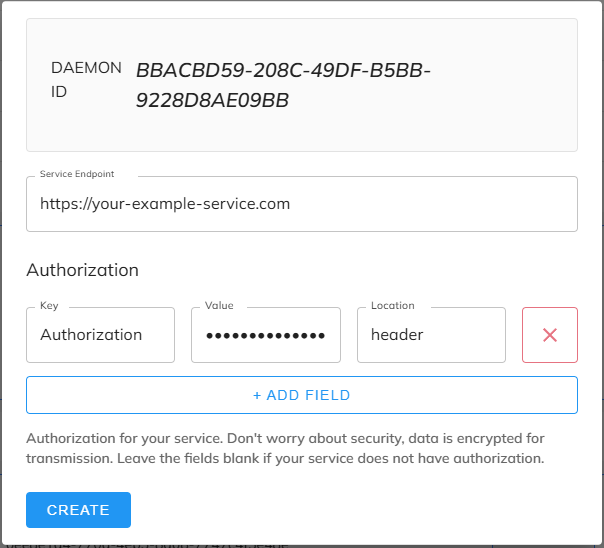
WARNING
Ensure your new service endpoint is accessible before updating to avoid downtime.
Full-Stack Deployments
Push changes to the default branch of the connected GitHub repository. The platform detects the update and automatically redeploys through the full lifecycle — no manual action required.
Pricing
TIP
This section applies only to Full-Stack deployments. Daemon Only deployments use a fixed monthly subscription.
The cost of each AI service call is calculated dynamically at the time of invocation. The final price takes into account:
- Model execution time — how long the AI model takes to process the request
- Compute resource cost — the cost of the serverless infrastructure used during execution
- FET token exchange rate — the current AGIX/FET to USD conversion rate
- Platform commission — a service fee applied by the platform
WARNING
Keep your provider balance funded. If your balance falls below the cost of a call, service invocations will be rejected until you top up.
Balance and Payments
Top Up
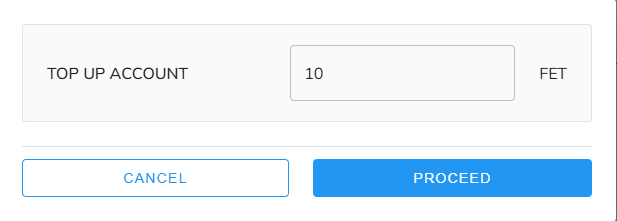
To add funds to your account:
- Click Top Up on the My Deployments page
- MetaMask will prompt you to approve the FET token transfer
- Your balance will be updated after the transaction is confirmed
TIP
Keep your balance funded to avoid service interruption. When you top up after expiration, the daemon restarts and the new subscription period begins from the moment of payment.
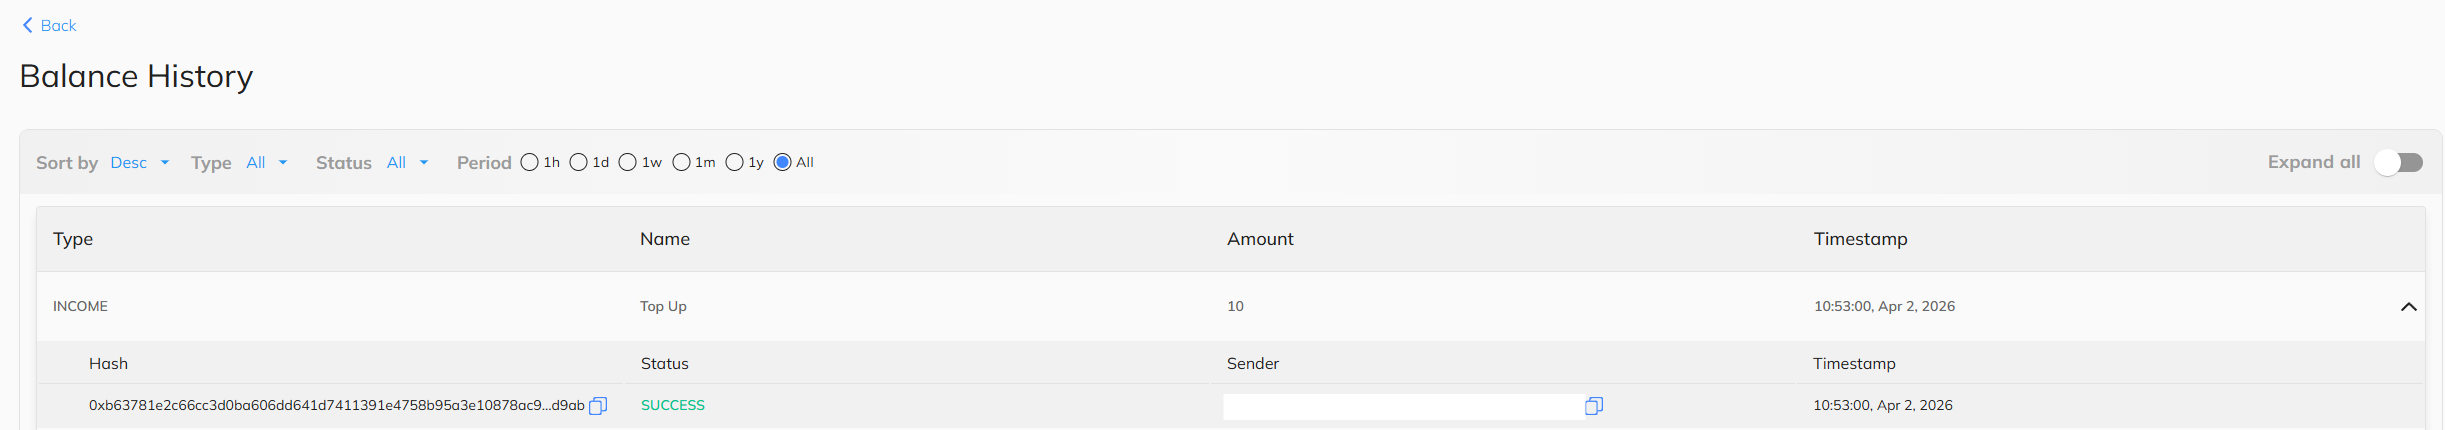
Balance History
View your full payment history from the My Deployments page. The Balance History page shows:
| Column | Description |
|---|---|
| Type | Transaction type (e.g., INCOME) |
| Name | Transaction name (e.g., Top Up) |
| Amount | FET token amount |
| Timestamp | Date and time of the transaction |
Expand any row to see additional details:
| Field | Description |
|---|---|
| Hash | Blockchain transaction hash |
| Status | Transaction status (e.g., SUCCESS) |
| Sender | Wallet address of the sender |
You can filter transactions by Sort order, Type, Status, and Period (1h, 1d, 1w, 1m, 1y, All).